
On this page
- What health data visualization means in a clinic
- The chart types that do the work
- Design principles that hold up
- Reference ranges decide what the chart means
- Getting data in: the step before the chart
- Interpretation, not decoration
- Common mistakes
- Our perspective
- Privacy and HIPAA when you visualize patient data
- How to evaluate visualization in clinic software
- Trying it in your own clinic

Key takeaways
- Visualization reduces the effort needed to find and interpret information. Line charts, small trend markers and color-coded flags do most of the useful work in clinical settings.
- Longitudinal views, combined data types and clear next actions are what users ask for most in patient data dashboards.
- Design with the people who will use the dashboard, and fit it into existing routines. Most published dashboards were built ad hoc.
- Reference ranges drive the meaning of every chart, so a clinic should be able to set its own.
- Any software that stores patient data for a clinic should come with a HIPAA business associate agreement (BAA).
Health data visualization turns raw clinical data (lab values, vitals, visit notes, patient-reported measures) into charts, tables and dashboards that a clinician can read in seconds. For a cash-pay longevity, functional medicine, concierge or hormone clinic, the goal is narrow and practical: show each patient's biomarkers over time, against ranges your clinicians have chosen, in a form that supports the next decision. This guide covers what the research says about which visuals work, how to design them, and how to avoid the common mistakes.
What health data visualization means in a clinic
Visualization is the transformation of data into visual representations to support effective and efficient cognitive processing, as a 2018 study of dashboards and quality of care in the United States puts it. In a clinic, that means a clinician opens a chart and sees the pattern before reading a single number.
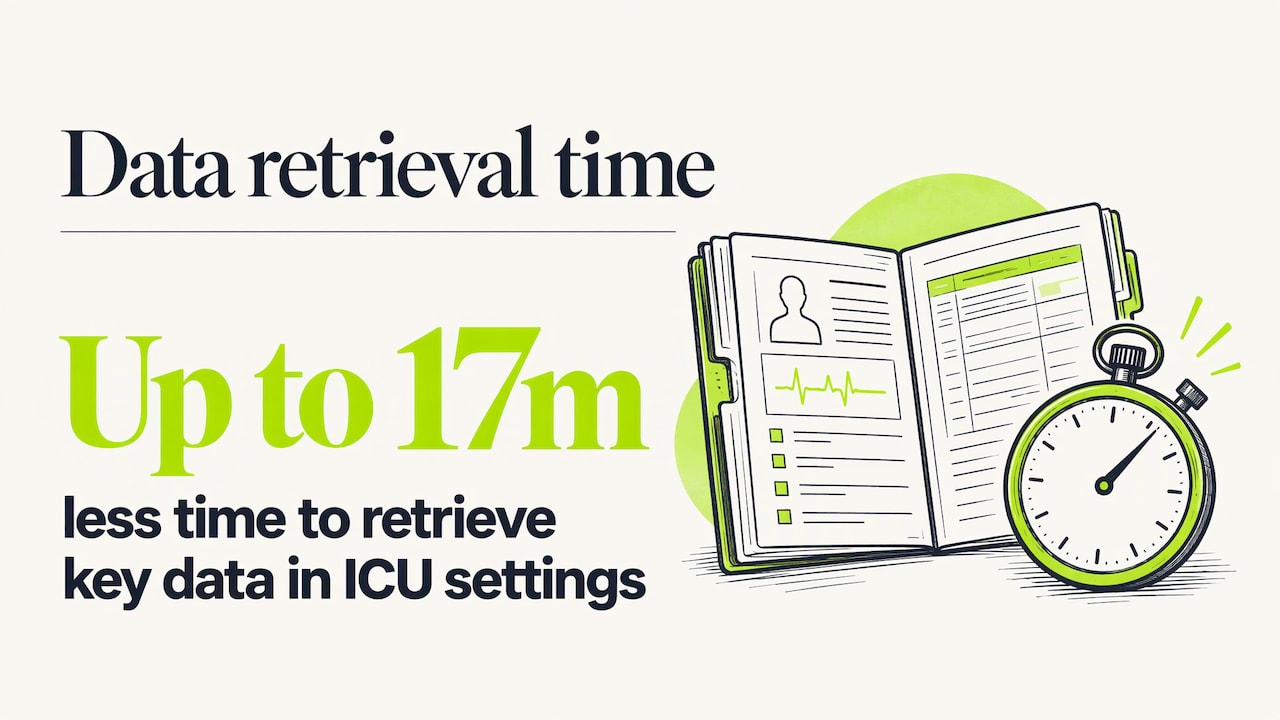
The need is real. A 2025 review on visual summarization for clinical reasoning describes visualization as a way to cut cognitive load, speed up pattern recognition and streamline tasks such as diagnosis and patient management. The same review reports that visualization-based decision support tools reduced the time needed to retrieve key data by up to 17 minutes in intensive care settings. That is an ICU figure, so it should not be read as a promise for an outpatient practice, but the direction is clear: less hunting, more thinking.
For a longevity practice the data is different from a hospital's. You are rarely watching a patient minute by minute. You are tracking slow movement across many markers: apoB, fasting insulin, HbA1c, hs-CRP, testosterone, thyroid markers, vitamin D, and so on, drawn every few months. The central visualization problem is therefore time: does this value move, in which direction, and how fast, relative to the target the clinician set?
The chart types that do the work
Research on patient-generated data and dashboards converges on a short list of formats.
A 2023 scoping review of patient-generated health data visualization lists line graphs, box plots, bar plots and calendar views as common formats. Its examples include plotting blood glucose over time and showing a four-week overview of abnormal measurements. A 2022 scoping review of 18 clinical indicator dashboards found that half of them combined bar charts, tables and line charts. In public health, a 2025 scoping review in Frontiers in Digital Health adds scatter plots, heatmaps and choropleth maps to the list.
Most of those are built for populations. A clinic mainly needs the first group. Here is how the formats map to common clinic tasks.
| Format | Best for | Example in a longevity clinic |
|---|---|---|
| Line chart | One marker over many draws | LDL or apoB across four quarterly panels |
| Line chart with a shaded range band | Seeing whether a value sits inside the target | Fasting glucose against the clinic's own optimal band |
| Small trend marker (sparkline or arrow) | Direction at a glance in a list of markers | A panel summary showing which markers rose, fell or held |
| Bar chart | Comparing a few discrete values or groups | Membership counts by tier, visits by provider |
| Table with color flags | Dense lab panels | A full metabolic panel with flagged rows |
| Calendar view | Adherence and scheduling patterns | Follow-up visits and draw dates across a year |
| Box plot or histogram | Spread across many patients | Clinic-level outcome reporting, not individual care |
The small trend marker deserves attention. The 2025 visual summarization review describes miniature sparkline and arrow charts in ICU dashboards that show the trajectory of a lab value without requiring the reader to interpret raw numbers. The same idea works in a 60-marker longevity panel: show the current value, the direction and a tiny history, and let the clinician click through only where something changed.
Design principles that hold up
Start with the question, not the data
A dashboard should answer a specific clinical or operational question for a specific user. A physician preparing for a follow-up visit asks: what changed since the last draw, and what did we plan to change? An operator asks: how many members are active, and which care plans are overdue for review? Those are two different screens.
A 2024 scoping review of 118 healthcare dashboards found that 82.2% were designed for frontline clinical staff, with 36.4% serving clinical purposes and 45.8% administrative ones. The mix shows that dashboards serve both roles. Keeping the roles on separate views prevents a clinical screen from filling up with business metrics.
Show the summary first, with a path to detail
Khairat and colleagues, writing in the 2018 dashboard study, argue that dashboards add the most value by offering a concise overview of key indicators and letting clinicians choose when to dive deeper into the underlying EHR data. In practice: a patient overview with the five to ten markers the care plan targets, and a drill-down to the full panel, the original lab report and the clinician's notes.
Put time on the horizontal axis
In the patient-generated data review, users prioritized longitudinal display, aggregation of multiple data types and actionability. For a longevity clinic, longitudinal display is the core of the job, because one draw says little and a series says a lot. Our guide to the longitudinal health record covers how clinics assemble that history in the first place.
Use color with discipline
Semantic coloring is common in clinical dashboards: red for abnormal values, or stoplight coding for severity levels, according to the same 2023 review. The 2025 visual summarization review likewise recommends semantic color, such as red for concerning results, alongside miniature trend charts.
A few rules make color safer:
- Reserve red for values that need action, so it keeps its meaning.
- Never rely on color alone. Pair it with an icon, a label or an arrow so color-blind users and printouts still work.
- Keep one legend across the whole product. If amber means "watch" on one screen, it cannot mean "borderline" on another.
- Make the range behind the color visible. A flag with no stated threshold invites misreading.
Fit the workflow
A 2026 scoping review of dashboard design practices found that only 22.2% of studies used structured design guidelines, while 77.8% of implementations were described as ad hoc. It also observes that effective dashboards are embedded in existing clinical workflows and governance routines so they do not overburden staff. If a chart lives in a separate tool that someone must remember to open, it will go unused. The best place for a biomarker trend is the screen where the clinician already writes the note and builds the plan.
Test with real users
The 2024 review of 118 dashboards recommends involving end users in design and formative usability testing, and using meaningful, reliable and timely metrics. It also notes that development often skips steps that confirm a dashboard suits its users and clinical context. A simple version for a small clinic: sit with two clinicians and one coordinator, give them three real tasks (fictional patient data is fine), and watch where they hesitate.
Reference ranges decide what the chart means
A line chart of a biomarker is only as useful as the band drawn behind it. Many longevity and functional medicine practitioners work to ranges tighter than the standard laboratory reference interval, and they differ from one another by philosophy, age group and sex. If the software forces a lab's default range, the chart will flag values the clinician considers fine and miss values the clinician cares about.
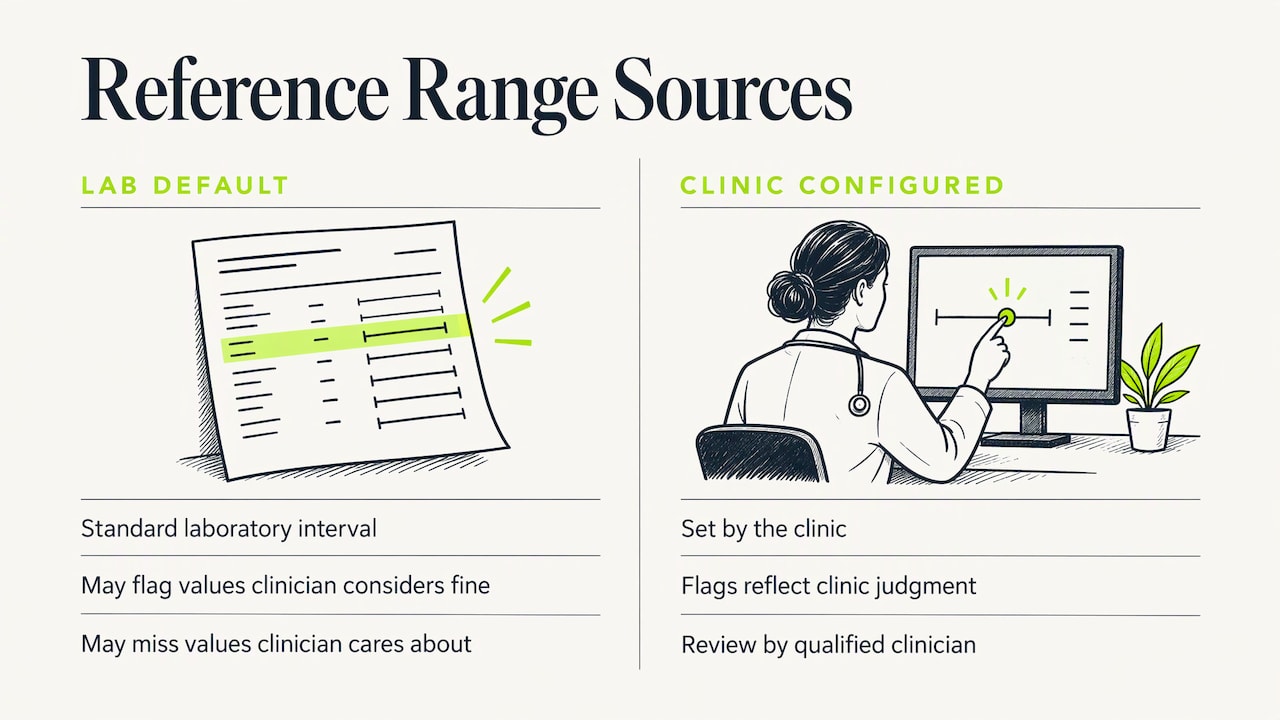
That is why range configuration is a visualization feature as much as a data feature. When the clinic sets the bands, color flags, trend markers and summary lists all reflect the clinic's clinical judgment. Browse the biomarker library for an example of how markers can be organized, and see how a functional medicine EHR with custom lab ranges approaches the setup.
Any range, whether the lab's or the clinic's, should be reviewed by a qualified clinician. Software displays a range; it does not decide what is right for a patient.
Getting data in: the step before the chart
A dashboard is only as good as the data behind it. The 2026 design practice review tells providers to consider data quality, accuracy and timeliness, and to address security and privacy when designing and adopting dashboards. For labs, the practical bottleneck is usually entry. Results arrive as PDFs from different labs with different marker names and units. Retyping them is slow and invites errors, which then show up in the chart as false trends.
Our AI lab extraction reads uploaded lab reports and maps results into the clinic's own biomarker ranges, and a provider reviews the extracted values before they are used. That review step matters: a chart built on an unchecked number is a confident picture of a possible mistake. Check units too. A glucose in mg/dL and one in mmol/L plotted on the same axis will look like a dramatic change that never happened.
A short checklist before trusting any trend line:
- Same marker name and unit across every draw
- Same lab, or a note when the lab changed (methods can differ between labs)
- Draw conditions recorded where they matter (fasting, time of day, medication timing)
- A clinician has reviewed each imported value
Interpretation, not decoration
Clinicians do not only want pictures. The 2023 patient-generated data review reports that clinician users ask for interpretation, meaning and guidance, and that some call for AI and machine learning to help interpret the data. It also notes that best practices for implementation are still developing.
The sensible reading for a clinic is to keep the clinician in charge. A chart should surface what changed. The care plan should record what the clinician decided to do about it. Our care plan software ties plans to a clinic's own templates, so the decision sits next to the data that prompted it.
Common mistakes
- Too many markers on one screen. Pick the targeted markers for the overview and push the rest one click down.
- Truncated axes. A y-axis that starts just below the lowest value turns a 2% change into a cliff. Use a sensible baseline or show the range band.
- Mixed time intervals. Draws at two weeks and then eight months apart plotted at equal spacing distort the slope. Use a true time axis.
- Unlabeled thresholds. Show what the colored band represents.
- Patient-facing charts with no context. A patient who sees a red marker without an explanation may panic or disengage. Pair every patient-facing chart with a plain-language note from the care team.
- Treating the dashboard as finished. Revisit it after a quarter of real use.
Our perspective
We built LongevityEHR around one idea: in a longevity practice, the chart is the conversation. Patients on a membership often come back every few months for the same reason, to see whether the work is moving their numbers. If the clinician has to assemble that picture by hand from PDFs, the visit starts with administration instead of medicine.
So we start where the data starts. Labs are extracted into the clinic's own biomarker ranges, a provider reviews them, and the same record feeds care plans built from the clinic's templates, clinical notes, intake forms and scheduling with video visits. Memberships and payments run through the clinic's own Stripe account, and the patient portal carries the clinic's brand. The clinic's definition of "optimal" is the thing every view reflects.
We think the research points the same way: summary first, detail on demand, time on the axis, and design that fits the workflow. That is how we approach the product, and it is the standard we would suggest for any tool a clinic evaluates.
Privacy and HIPAA when you visualize patient data
A dashboard that shows patient data is a system that stores or processes protected health information, so privacy rules apply to it as much as to the chart behind it. According to HHS guidance on HIPAA and cloud computing, when a covered entity uses a cloud service provider to create, receive, maintain or transmit ePHI, the provider is a business associate, and the two must enter into a business associate agreement. The guidance states that this holds even when the provider stores only encrypted ePHI.
For a clinic, the practical steps are:
- Confirm that any software holding patient data is covered by a BAA before you upload real records.
- Limit who can see what. A front-desk coordinator rarely needs the full lab history.
- Keep screenshots and exports with patient data out of email and chat tools that are not covered by an agreement.
- Use fictional data for training, demos and marketing images.
For LongevityEHR, compliance is HIPAA, with a BAA on request. Details are on our security page. This is general information, not legal advice, and a qualified healthcare attorney or compliance professional should review your own obligations, including state privacy laws.
How to evaluate visualization in clinic software
When you compare platforms, run a short, concrete test rather than watching a scripted demo.
- Load a realistic fictional patient with at least four draws over a year and 30 or more markers.
- Change a range to your own and see whether every flag, trend marker and summary updates.
- Import a real lab PDF format you receive often and check how many values need correction.
- Find the trend for one marker in under ten seconds from the patient's overview.
- Look at the patient view. Would a patient understand it without a call?
- Ask about the BAA and about who can access which records.
For a wider look at what a clinic platform should include, see our overview of longevity clinic software features and the EHR for longevity clinics.
Trying it in your own clinic
If you want to see lab trends against your own ranges, you can test it with your own workflow. LongevityEHR has a Trial plan at $0 for 15 days. After the trial, the Core plan is $99 per provider a month, or $69.30 a month billed annually ($831.60 a year). The Scale plan is $199 per provider a month, or $139.30 a month billed annually ($1,671.60 a year). Enterprise is custom pricing. Annual billing is 30% off, and every plan has unlimited patients.
Compare the plans on the pricing page and start with a fictional patient to judge the charts yourself.

Run your longevity clinic on one system
- AI lab extraction with provider review
- Your ranges, every result as a trend
- Memberships through your own Stripe
15-day free trial. BAA on request.
Sources
- The Impact of Visualization Dashboards on Quality of Care (2018)
- Supporting clinical reasoning through visual summarization (2025)
- Visualization of Patient-Generated Health Data: A Scoping Review (2023)
- Dashboards on Clinical Indicator Data: A Scoping Review (2022)
- Visual communication of public health data, Frontiers in Digital Health (2025)
- Development, Implementation, and Evaluation Methods for Dashboards in Healthcare (2024)
- Design Practices for Data Dashboards in Health Care (2026)
- HHS: Guidance on HIPAA and Cloud Computing